As we mentioned earlier, reporting is one of Jenkins’s strong points. We have seen how easy it is to display test results and to publish Javadocs, but you can also publish a large number of other very useful reports using Jenkins’s plugins.
Plugins are another one of Jenkins’s selling points—there are plugins for doing just about anything, from integrating new build tools or version control systems to notification mechanisms and reporting. In addition, Jenkins plugins are very easy to install and integrate smoothly into the existing Jenkins architecture.
To see how the plugins work, we are going to integrate code coverage metrics using the Cobertura plugin. Code coverage is an indication of how much of your application code is actually executed during your tests—it can be a useful tool in particular for finding areas of code that have not been tested by your test suites. It can also give some indication as to how well a team is applying good testing practices such as Test-Driven Development or Behavior-Driven Development.
Cobertura is an open source code coverage tool that works well with both Maven and Jenkins. Our Maven demonstration project is already configured to record code coverage metrics, so all we need to do is to install the Jenkins Cobertura plugin and generate the code coverage metrics for Jenkins to record and display.
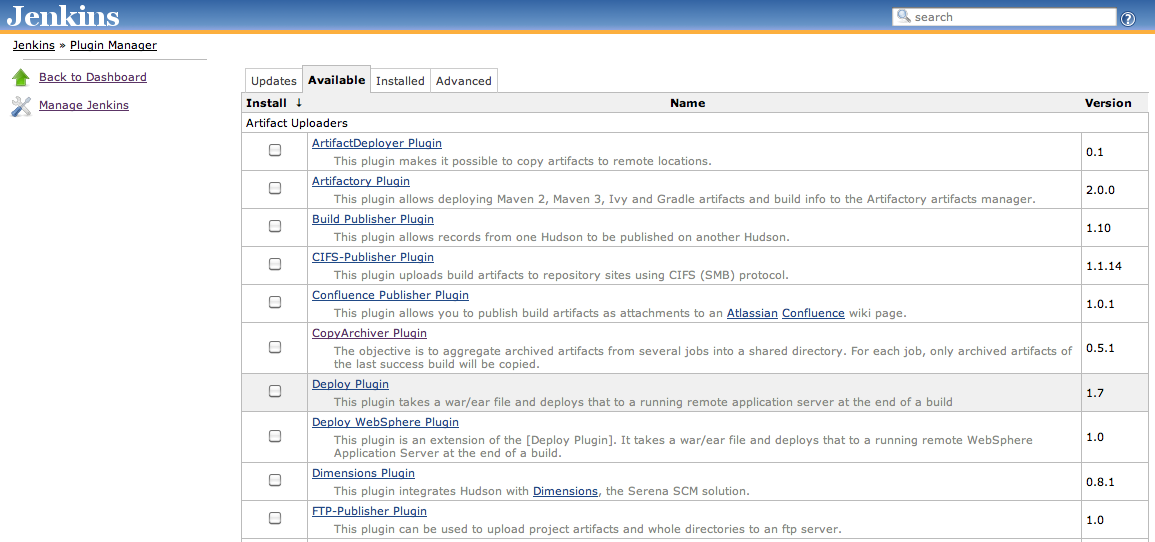
To install a new plugin, go to the Manage Jenkins page and click on
the Manage Plugins entry. This will display a list of the available
plugins as well as the plugins already installed on your server (see Figure 2.27, “Jenkins has a large range of plugins available”). If your build server doesn’t have
an Internet connection, you can also manually install a plugin by
downloading the plugin file elsewhere and uploading it to your Jenkins
installation (just open the Advanced tab in Figure 2.27, “Jenkins has a large range of plugins available”), or by copying the plugin to the
$JENKINS_HOME/plugins
directory.
In our case, we are interested in the Cobertura plugin, so go to the Available tab and scroll down until you find the Cobertura Plugin entry in the Build Reports section. Click on the checkbox and then click on the Install button at the bottom of the screen.
This will download and install the plugin for you. Once it is done, you will need to restart your Jenkins instance to see the fruits of your labor. When you have restarted Jenkins, go back to the Manage Plugins screen and click on the Installed tab—there should now be a Cobertura Plugin entry in the list of installed plugins on this page.
Once you have made sure the plugin was successfully installed, go to the configuration page for the gameoflife-default build job.
To set up code coverage metrics in our project, we need to do two things. First we need to generate the Cobertura coverage data in an XML form that Jenkins can use; then we need to configure Jenkins to display the coverage reports.
Our Game of Life project already has been configured to generate XML
code coverage reports if we ask it. All you need to do is to run
mvn cobertura:cobertura to generate the reports in XML
form. Cobertura can also generate HTML reports, but in our case we will be
letting Jenkins take care of the reporting, so we can save on build time
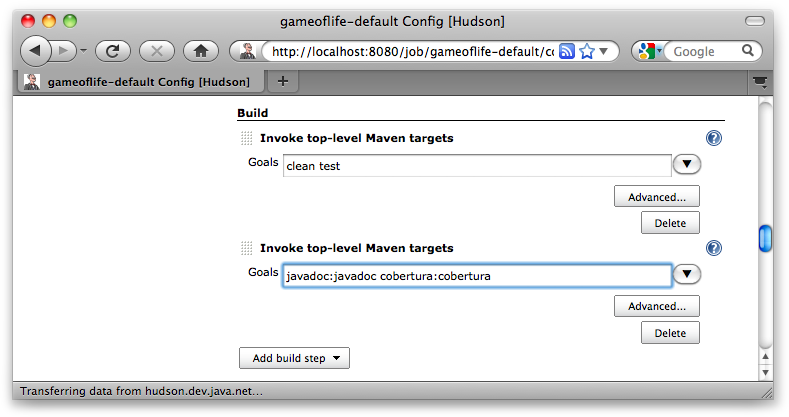
by not generating the For this example, for simplicity, we will just add
the cobertura:cobertura goal to the second build step
(see Figure 2.28, “Adding another Maven goal to generating test coverage
metrics”). You could also
add a new build step just for the code coverage metrics. In a real-world
project, code quality metrics like this are typically placed in a distinct
build job, which is run less frequently than the default build.
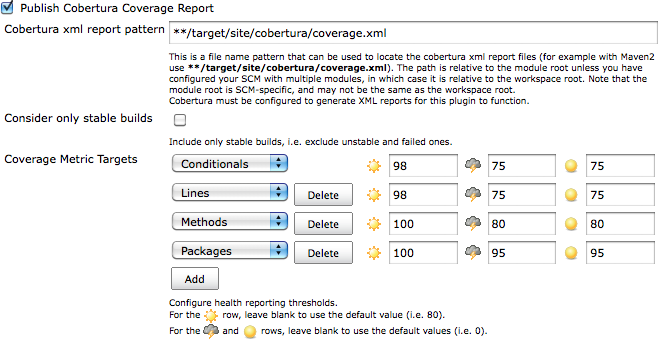
Next, we need to tell Jenkins to keep track of our code coverage metrics. Scroll down to the “Post-build Actions” section. You should see a new checkbox labeled Publish Cobertura Reports. Jenkins will often add UI elements like this when you install a new plugin. When you tick this box, Jenkins will display the configuration options for the Cobertura plugin that we installed earlier (see Figure 2.29, “Configuring the test coverage metrics in Jenkins”).
Like most of the code-quality related plugins in Jenkins, the Cobertura plugin lets you fine-tune not only the way Jenkins displays the report data, but also how it interprets the data. In the Coverage Metrics Targets section, you can define what you consider to be the minimum acceptable levels of code coverage. In Figure 2.29, “Configuring the test coverage metrics in Jenkins”, we have configured Jenkins to list any builds with less than 50% test coverage as “unstable” (indicated by a yellow ball), and notify the team accordingly.
This fine-tuning often comes in handy in real-world builds. For example, you may want to impose a special code coverage constraint in release builds, to ensure high code coverage in release versions. Another strategy that can be useful for legacy projects is to gradually increase the minimum tolerated code coverage level over time. This way you can avoid having to retro-fit unit tests on legacy code just to raise the code coverage, but you do encourage all new code and bug fixes to be well tested.
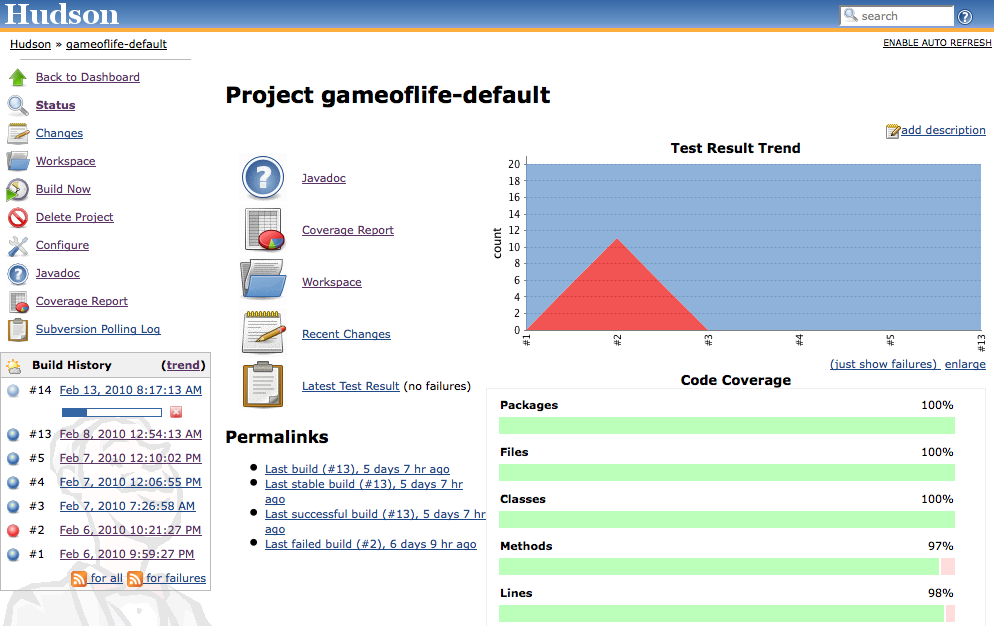
Now trigger a build manually. The first time you run the build job with Cobertura reporting activated, you will see coverage statistics for your build displayed on the build home page, along with a Coverage Report link when you can go for more details (see Figure 2.30, “Jenkins displays code coverage metrics on the build home page”). The Cobertura report shows different types of code coverage for the build we just ran. Since we have only run the test coverage metrics once, the coverage will be displayed as red and green bars.
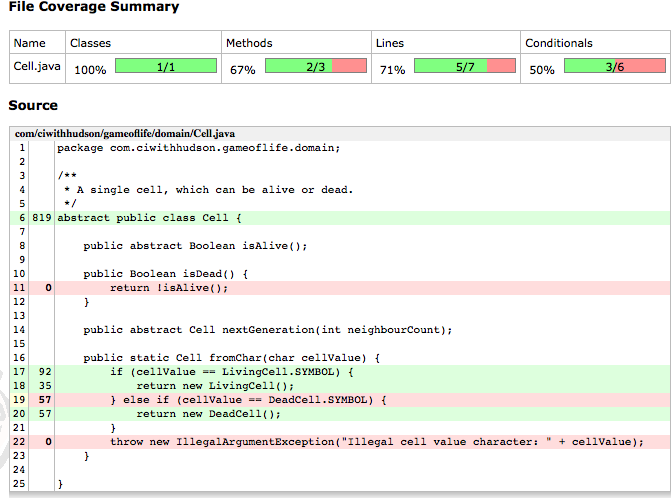
If you click on the Coverage Report icon, you will see code coverage for each package in your application, and even drill down to see the code coverage (or lack thereof) for an individual class (see Figure 2.31, “Jenkins lets you display code coverage metrics for packages and classes”). When you get to this level, Jenkins displays both the overall coverage statistics for the class, and also highlights the lines that were executed in green, and those that weren’t in red.
This reporting gets better with time. Jenkins not only reports metrics data for the latest build, but also keeps track of metrics over time, so that you can see how they evolve throughout the life of the project.
For example, if you drill down into the coverage reports, you will
notice that certain parts of this code are not tested (for example the Cell.java class
in Figure 2.31, “Jenkins lets you display code coverage metrics for packages and
classes”).
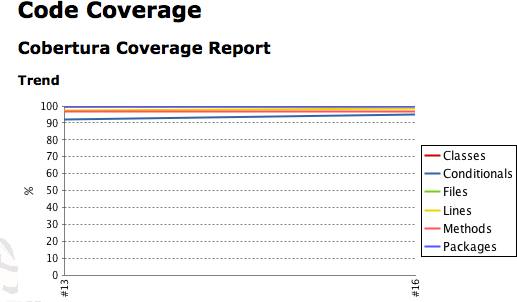
Code coverage metrics are a great way to isolate code that has not been tested, in order to add extra tests for corner cases that were not properly tested during the initial development, for example. The Jenkins code coverage graphs are also a great way of keeping track of your code coverage metrics as the project grows. Indeed, as you add new tests, you will notice that Jenkins will display a graph of code coverage over time, not just the latest results (see Figure 2.32, “Jenkins also displays a graph of code coverage over time”).
Note that our objective here is not to improve the code coverage just for the sake of improving code coverage—we are adding an extra test to verify some code that was not previously tested, and as a result the code coverage goes up. There is a subtle but important difference here—code coverage, as with any other metric, is very much a means to an end (high code quality and low maintenance costs), and not an end in itself.
Nevertheless, metrics like this can give you a great insight into the health of your project, and Jenkins presents them in a particularly accessible way.
This is just one of the code quality metrics plugins that have been written for Jenkins. There are many more (over fifty reporting plugins alone at the time of writing). We’ll look at some more of them in Chapter 9, Qualité du Code.